

LAUREL REALTY & INVESTMENT
Local Insights
A closer look at San Bruno and the Peninsula—local housing numbers, neighborhood stories, and the changes shaping our community.
San Bruno Market Snapshot · SEPTEMBER 2026
September 2025: 24 sales · Median $1,332,000
Average sale price reported in the newsletter: $1,489,000
The October edition lists 17 available homes and 20 contingent/pending homes. September closed sales range from $850,000 to $2,110,000. These figures describe the original newsletter snapshot, not current availability.
Latest update: October 2026 newsletter · Sales figures reflect September 2026.
Single-Family Home Sales
September 2025 vs. September 2026 · San Bruno & the Peninsula
| City | 2025 Sales | 2025 Median $ | 2026 Sales | 2026 Median $ |
|---|---|---|---|---|
| San Bruno | 24 | $1,332,000 | 10 | $1,390,000 |
| Millbrae | 9 | $1,900,000 | 9 | $2,380,000 |
| Burlingame | 20 | $2,997,500 | 14 | $3,287,500 |
| San Mateo | 53 | $2,285,000 | 39 | $2,050,000 |
| South San Francisco | 22 | $1,275,000 | 14 | $1,505,750 |
| Daly City | 33 | $1,200,000 | 33 | $1,230,000 |
| Foster City | 12 | $2,080,000 | 4 | $2,562,000 |
| Belmont | 10 | $2,304,444 | 10 | $2,304,444 |
| San Carlos | 22 | $2,590,000 | 19 | $2,750,000 |
| Redwood City | 44 | $2,130,000 | 41 | $2,455,000 |
| Pacifica | 16 | $1,337,500 | 20 | $1,350,000 |
| Half Moon Bay | 10 | $1,725,000 | 7 | $1,940,000 |
| Hillsborough | 10 | $5,355,000 | 12 | $6,075,000 |
Source: Laurel Realty’s October 2026 newsletter. Monthly medians reflect the homes sold during each reporting period.
Neighborhood Newsletters
Explore the latest stories and market updates.
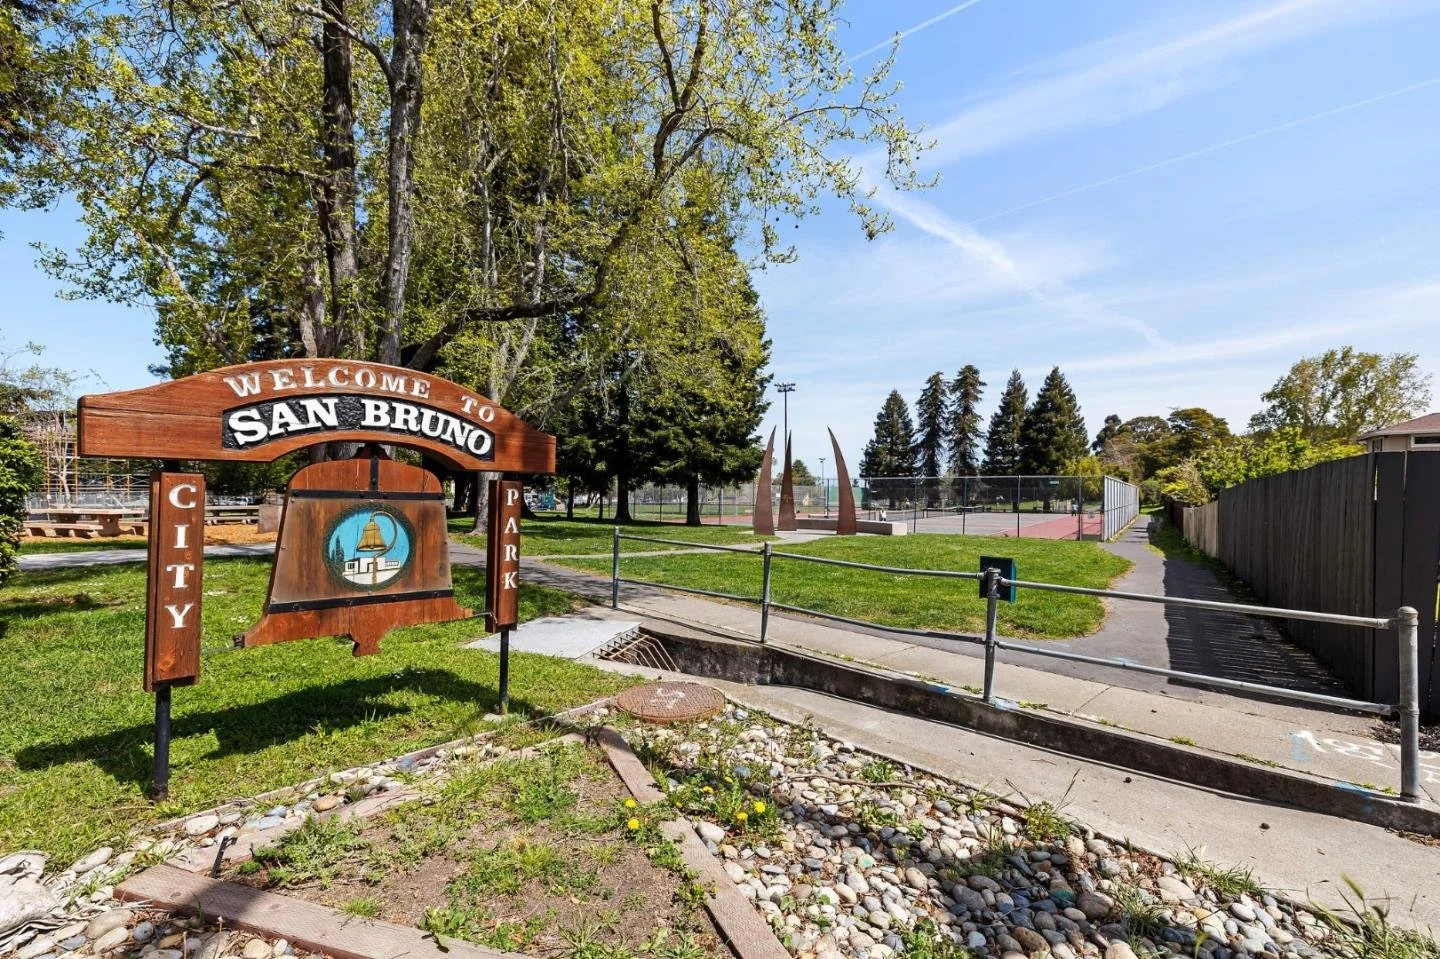
Parkview Terrace: A Neighborhood on the Rise
October 2026: Parkview Terrace, San Bruno City Park and neighborhood home values, plus September home sales.
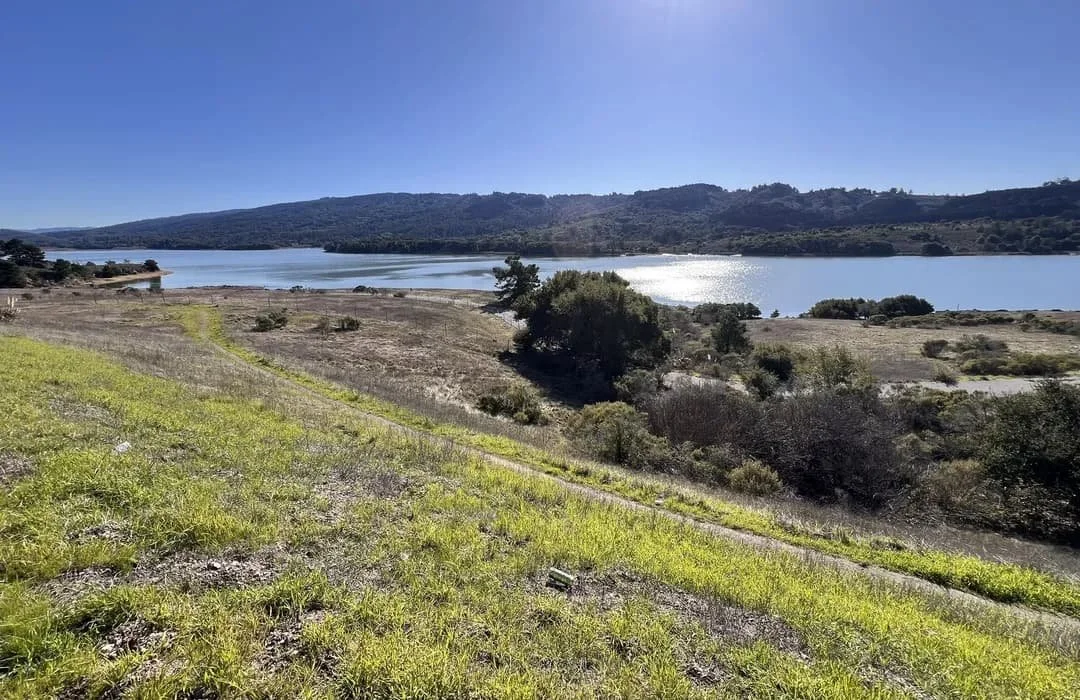
Crystal Springs Reservoir & the Local Housing Market
September 2026: Crystal Springs Reservoir and the Peninsula’s protected landscape, plus August home sales.
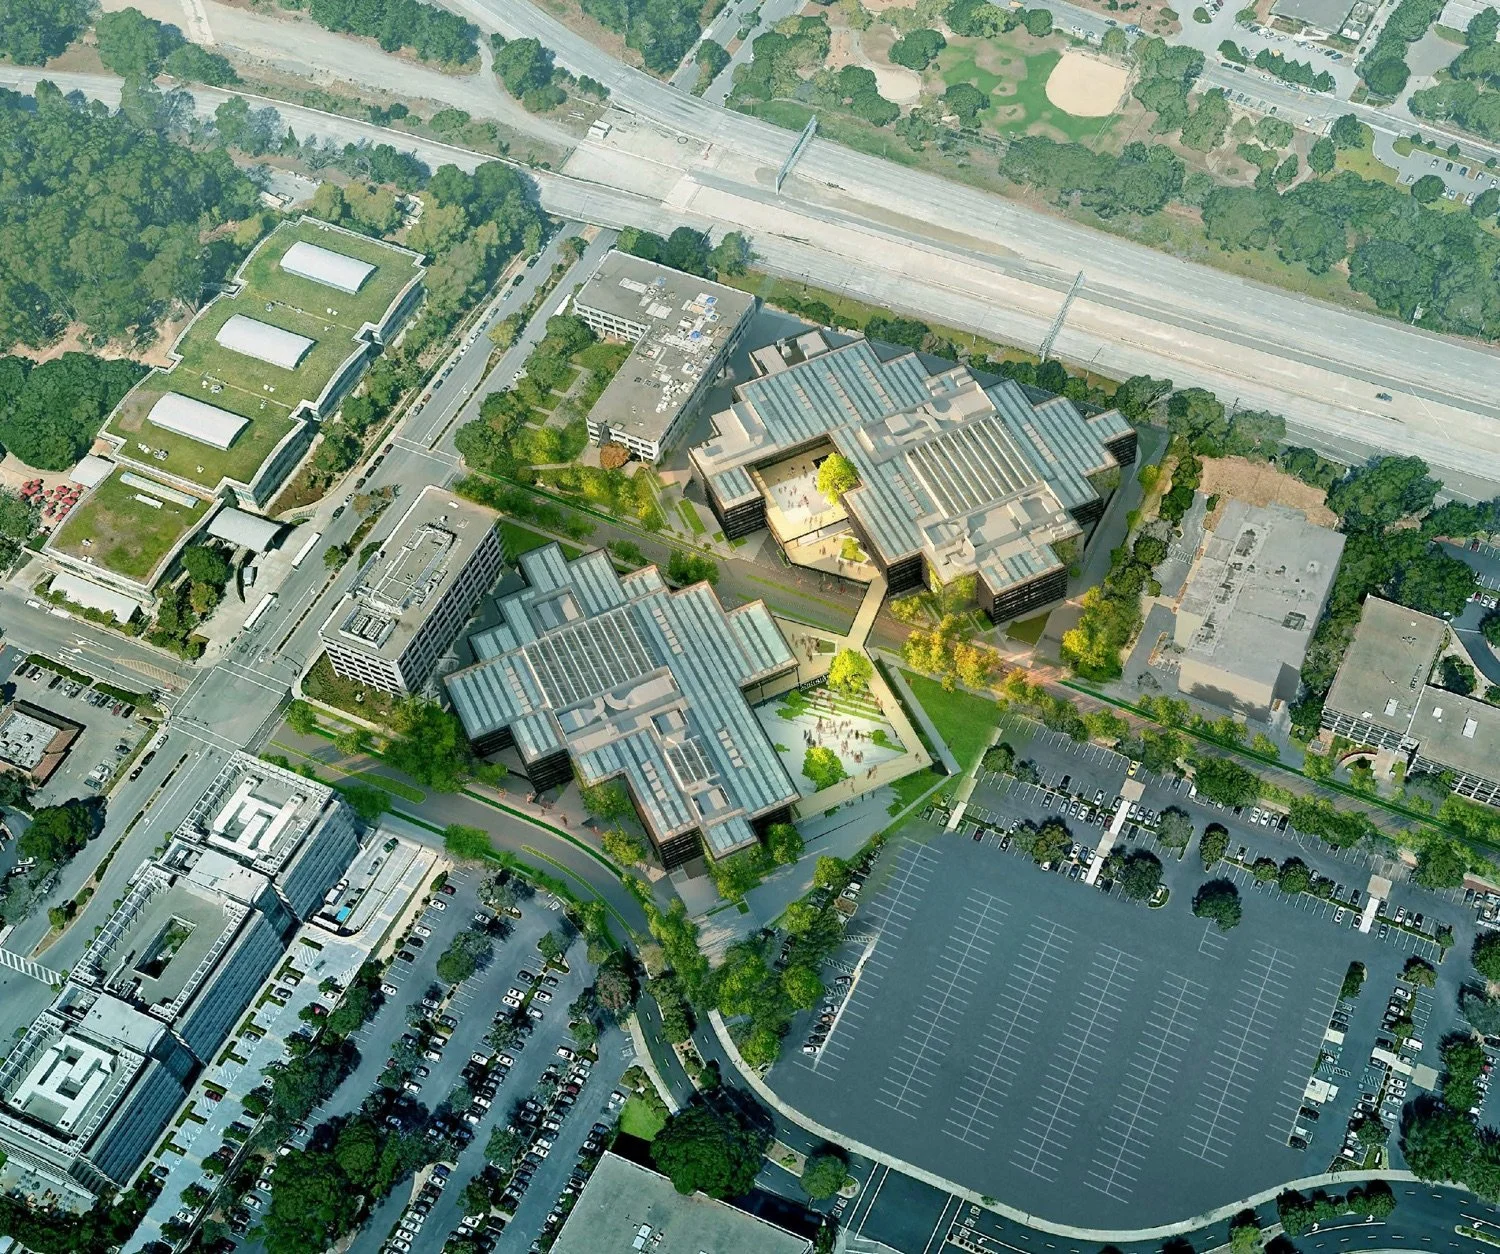
New Development in San Bruno & Millbrae
August 2026: New housing and investment in San Bruno and Millbrae, plus July home sales.
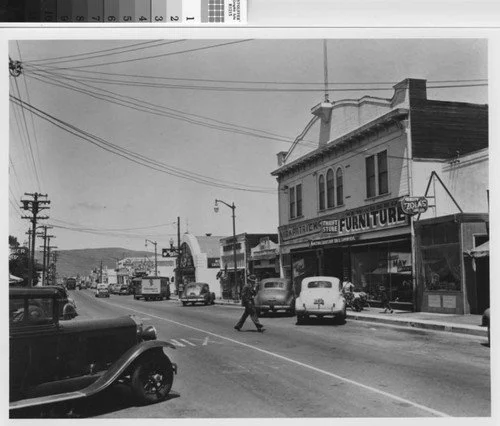
The Shared History of San Bruno & Millbrae
July 2026: The shared history of San Bruno and Millbrae, plus May–June home sales.
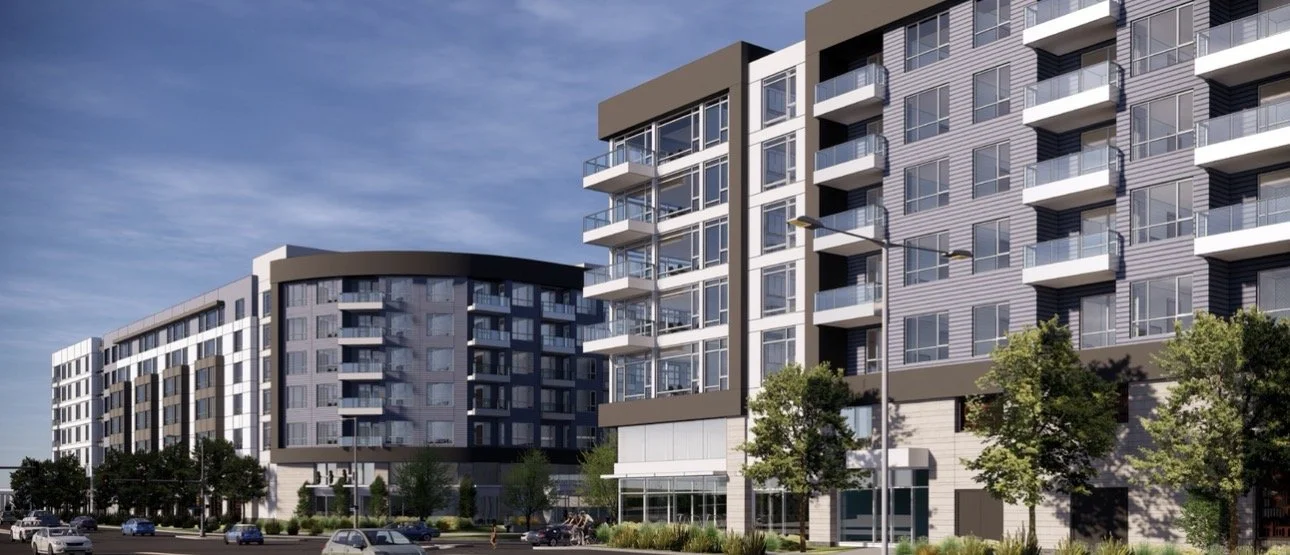
South San Francisco’s Housing Development
May 2026: South San Francisco’s housing pipeline and San Bruno’s April sales.